Scenario:
You need to keep track and analyze DNS requests and responses for one of your running geohosts by configuring and customizing graphical reports.
How to configure it:
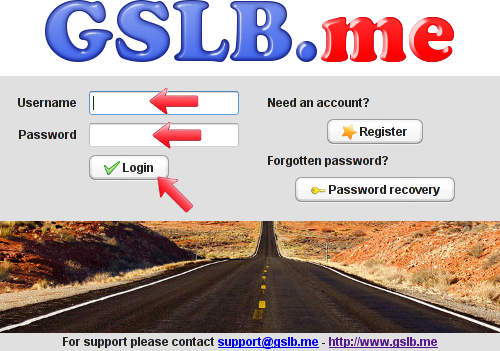
Log on to GSLB.me using your credentials or register if you still don’t have an account:
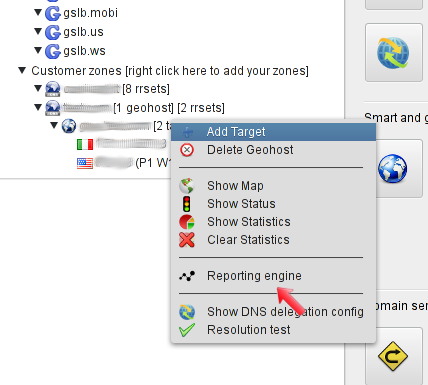
To create a new graph from the main screen you can either right-click on the geohost name and select “Reporting engine“:
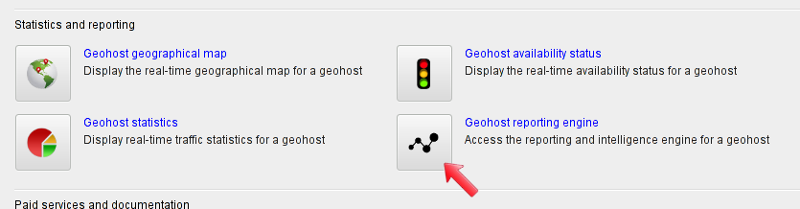
Or you can select the “Geohost reporting engine” from the main panel:
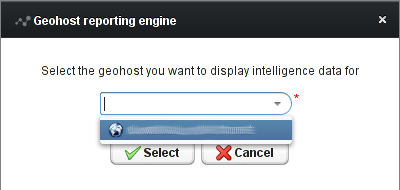
After clicking the “Geohost reporting engine” icon you can select the geohost you want to define graphs for using the dropdown menu:
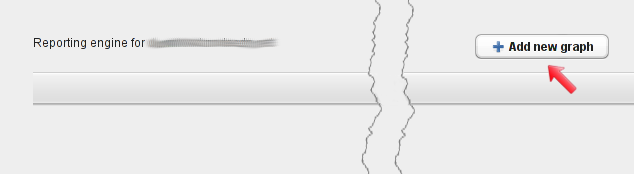
Accessing the “Geohost reporting engine” brings you to the main graphs configuration section, which is initially empty. Clicking on the “Add new graph” button allows you to configure and customize your graph(s):
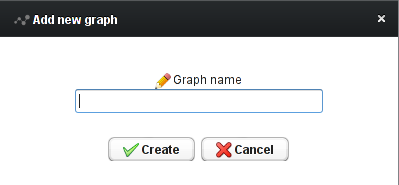
In order to create a new graph, its descriptive name must be specified. This is a purely mnemonic name and can’t be changed:
After typing the name, a default graph is set up, to display geohost DNS requests and responses (split by target) over the last 24 hours. Several other parameters such as font size, resolution, colors, etc are set to default values. After making changes, you can click on the “Save and update graph” button at the bottom of the page to commit and to display the updated graph.
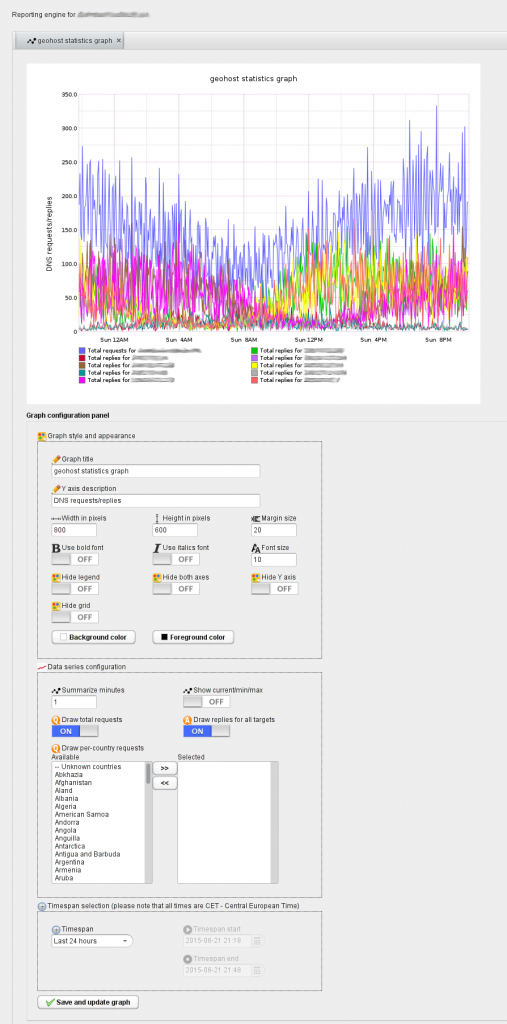
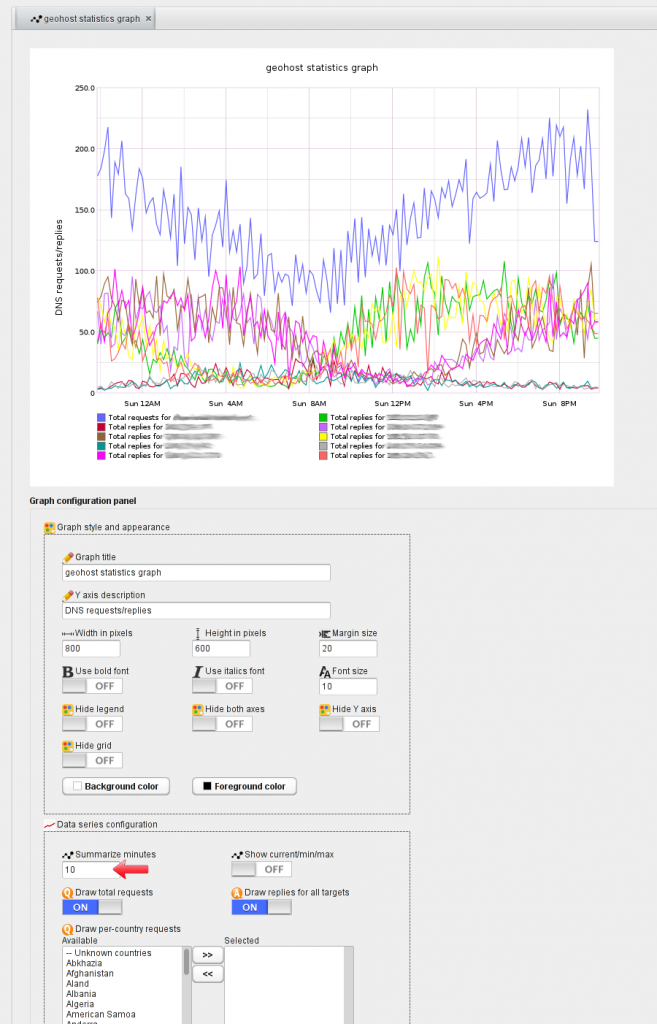
The newly created graph can be fully modified and customized by setting its parameters in the “Graph style and appearance“, “Data series configuration” and “Timespan selection” sections. For instance you can try to change the parameter “Summarize minutes” from the default value of 1 to 10: this tells GSLB.me to display the graph averaging values over 10 minutes timeframes. By default data is averaged every 60 seconds. After setting “Summarize minutes” to 10 you need to click the “Save and update graph” at the bottom of the screen to commit changes.
As a further example. you might want to display only DNS requests sent to your geohost: the default graph also displays per-target DNS responses. In order to disable the latter, you can turn off the “Draw replies for all targets” switch. Once done, you can click on the “Save and update graph” button at the bottom of the screen:
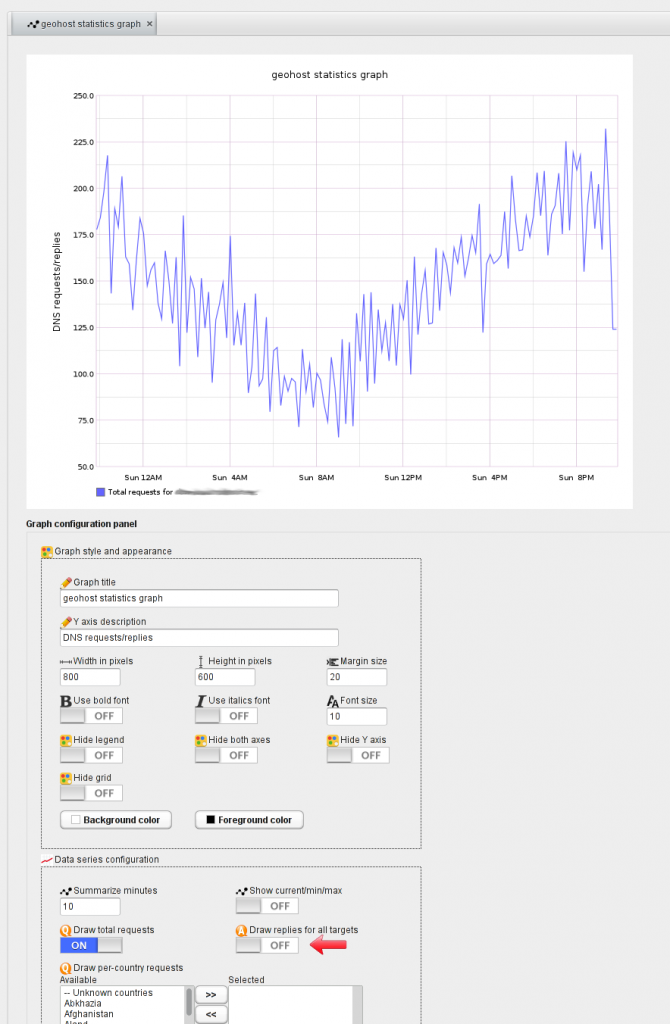
The updated graph is then displayed.
You can define an unrestricted number of additional graphs, to keep track of DNS requests and responses, and to show different geohost-related scenarios.
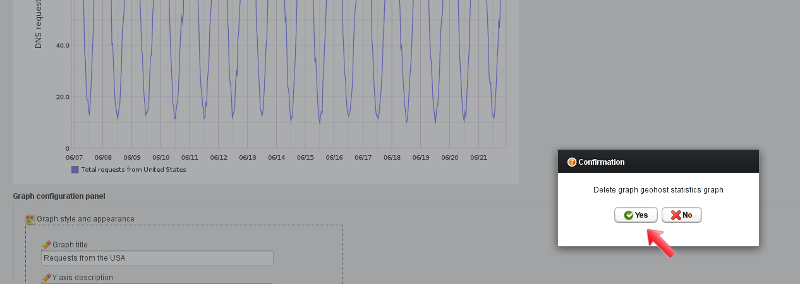
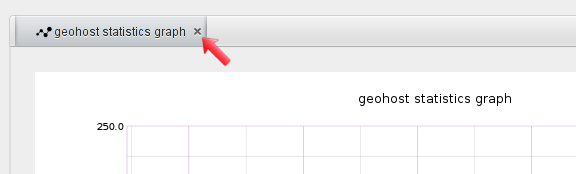
To delete an existing graph you can click on the “X” close to the graph title, in the tab row at the top of the screen:
A confirmation window is displayed, and you can click “Yes” to delete the selected graph: