
Metrics provide a powerful way to support pushing performance and availability data to GSLB.me for a specific target belonging to a defined geohost.
Pushing performance and availability indicators allows the creation of sophisticated and flexible expressions that drive the DNS balancing/georouting algorithms used by GSLB.me.
Variables such as CPU usage levels, disk space, free/used memory, network latencies and others can be evaluated to determine whether your servers and infrastructure usage and performance levels are in line with the expected quality of service/end user experience.
Geohosts are based on one or more targets: metrics are pushed to GSLB.me on a per-target basis, to populate a set of variables that are evaluated to determine the availability status of the target itself.
Key features
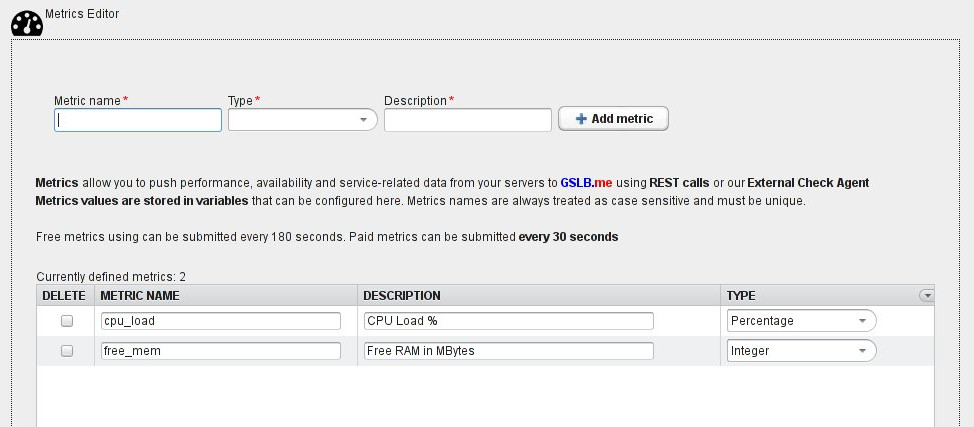
Metrics allow fine-grained control of your services availability and performance:
- they are pushed to GSLB.me by external applications/scripts trough simple HTTP POST requests
- they can can refer to any kind of information/data that can map a service status, availability, speed and performance levels
- they can be asynchronous (GSLB.me standard checks are synchronous and are triggered at configurable time intervals)
- they can be pushed to GSLB.me every 30 seconds (180 seconds for free users) and at least once every 5 minutes
- once pushed they are evaluated by fully customized expressions that participate to your geohosts balancing/georouting algorithm
Metrics are pushed to GSLB.me on a per-target basis and they are fully compatible and usable with all available balancing/georouting algorithms.
The main difference between standard and passive checks is that the former are built-in and run at regular intervals polling and checking your services, whereas the latter are pushed to GSLB.me by your own infrastructure/applications.
Use case
Metrics are useful for monitoring services and performance/availability indicators that are:
- Asynchronous and cannot be checked by polling their status on a regularly scheduled basis
- Positioned behind a firewall/behind NAT so that they can’t be checked by GSLB.me using its standard checks
Examples of asynchronous indicators/variables that can be passively monitored include:
- SNMP traps
- SNMP MIBs
- Syslog events
- Network-related data: latency, packet loss, congestion
- Multi-tier applications monitoring: passive checks can push performance/availability indicators for all tiers (Web frontends, application servers, backend/DBMS)
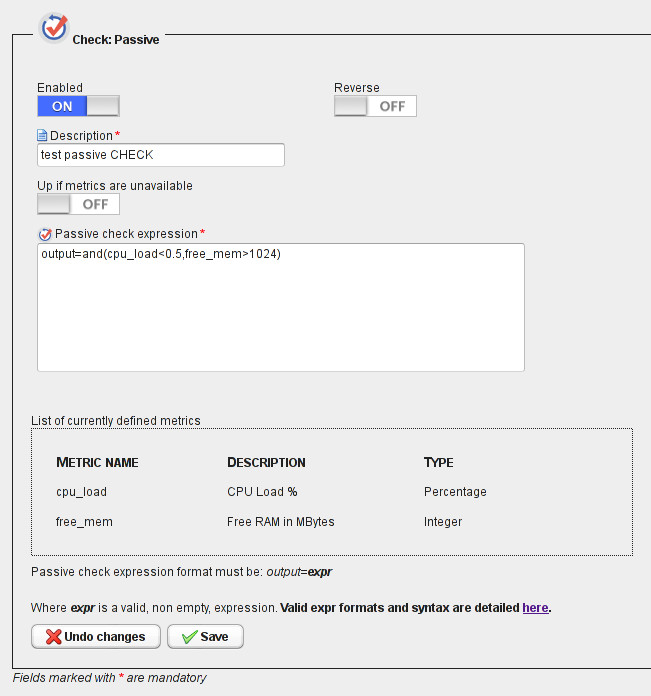
Passive checks
Passive checks are evaluated using flexible and fully customizable expressions that define the business/technical logic that determines whether, how and when your services are up and running, degraded or unavailable.
Arithmetic operators and logical functions are available to define your service and business rules. Raw performance indicators and variables are evaluated together to build your services availability status.
Full documentation is provided on how to write and use evaluation expressions: out technical support team is ready to help you understanding, writing and optimizing your custom expressions, for free.
To start using passive checks you can read our howto.