
GSLB.me provides full visibility on your DNS services: the powerful data intelligence engine collects real-time data on all DNS queries and replies for your geohosts and zones.
The data collection system automatically gathers real-time key performance and usage indicators with no configuration required. All collected data can be displayed through an unlimited number of graphs that can be created on a per-geohost basis.
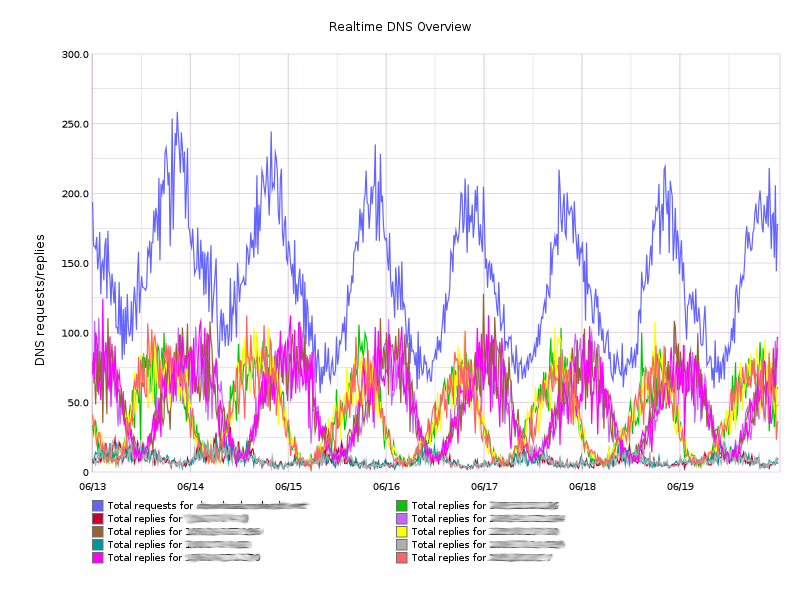
GSLB.me reporting and data intelligence feature allows you to generate an arbitrary number of fully customizable graphs to display the time distribution of your DNS resolution for your geohosts:
![]()
Geohosts reporting and statistics:
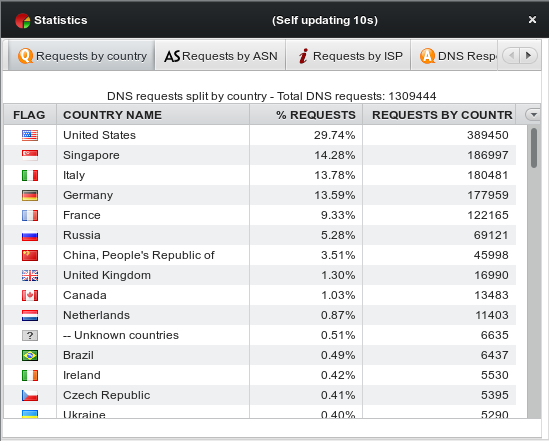
- DNS requests:
- Overall
- Per-country
- Per-ASN (Autonomous System)
- Per-ISP
- DNS responses:
- Per-target
- Per-country
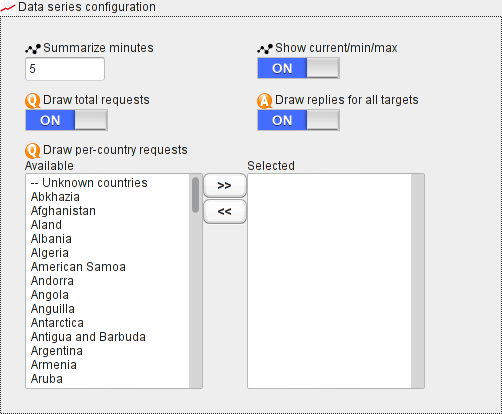
- Including aggregated data such as minimum/maximum/average
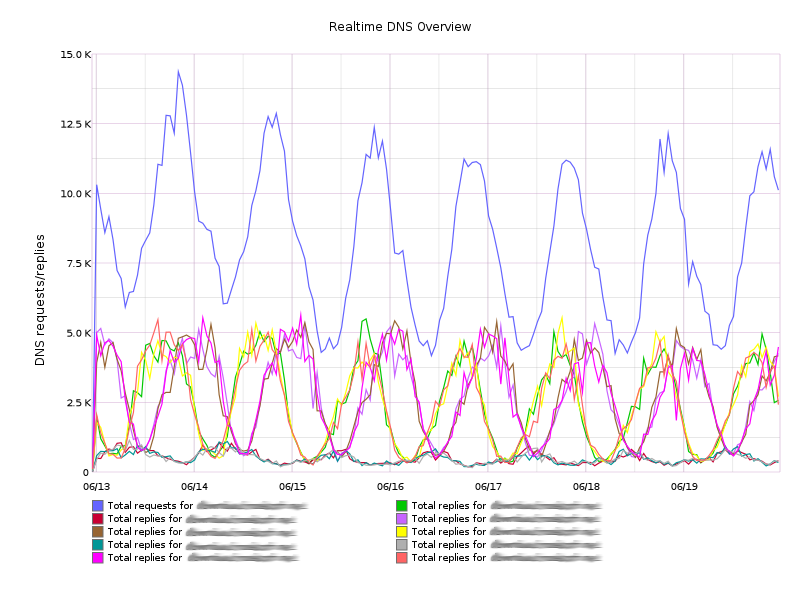
- Data summarization (average) over a customizable amount of time
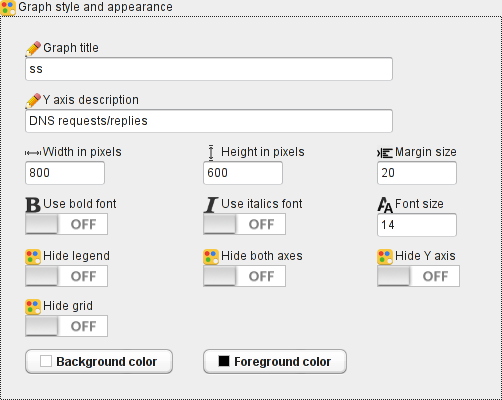
- Fully customizable look&feel
- All graphs are accessible via GSLB.me REST APIs
Zones reporting and statistics:
- DNS requests per record type and per FQDN
- Realtime geographical queries map
Graphs are fully customizable: their look and feel can be changed and tailored to your needs.
Data series can be selected to track your DNS services and how GSLB.me is responding to queries, requests can be tracked and displayed even on a per-country basis, and data can be summarized based on average values.
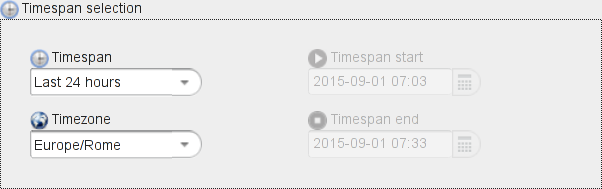
The data intelligence engine provides full, detailed visibility over any specific timeframe, ranging from 5 minutes to one year based on your geographical location and timezone.
Usage graphs are built dynamically and in real-time to provide a full view on how your geohosts are performing and to keep track of how smart DNS balancing is delivering your services.
Data can be aggregated and averaged over a customized amount of time to trim the amount of detail you need.
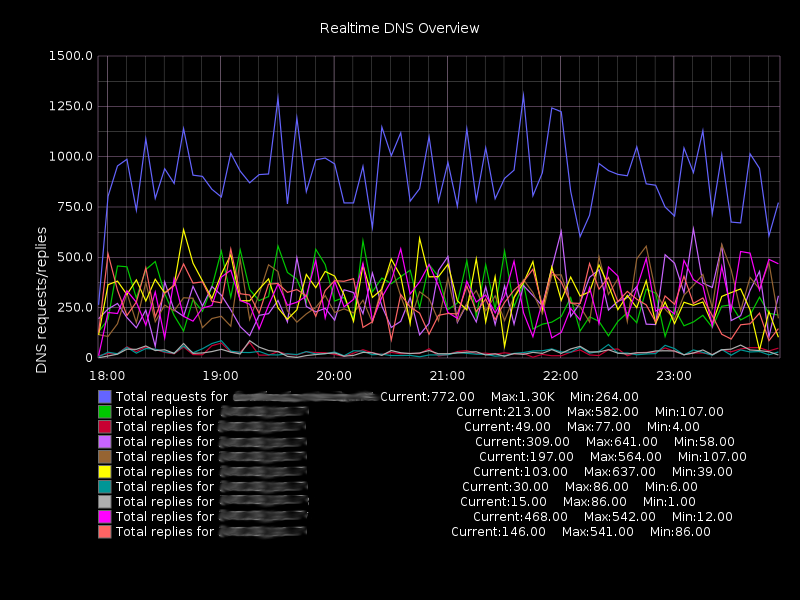
The look and feel and the amount and type of displayed information can be defined. Data intelligence provides all the tools needed to:
- understand how geohosts are working
- keep track of how the active smart DNS algorithm is handling requests
- carry on extensive trend analysis and capacity planning for services that are balanced across multiple geographical regions
- easily spot anomalies and problems
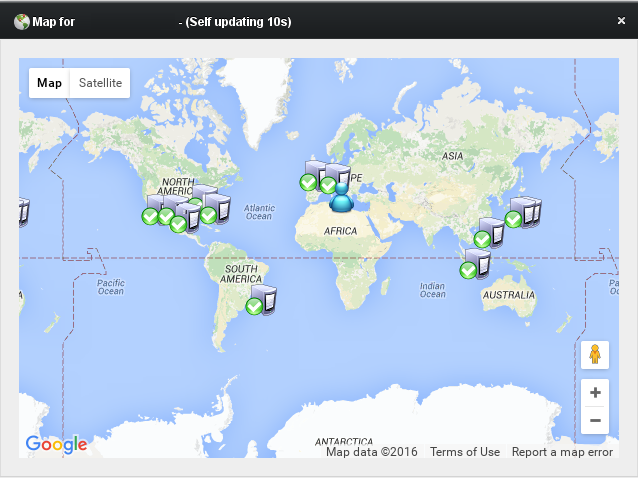
The queries map displays the geographical distribution of incoming DNS queries, in realtime:
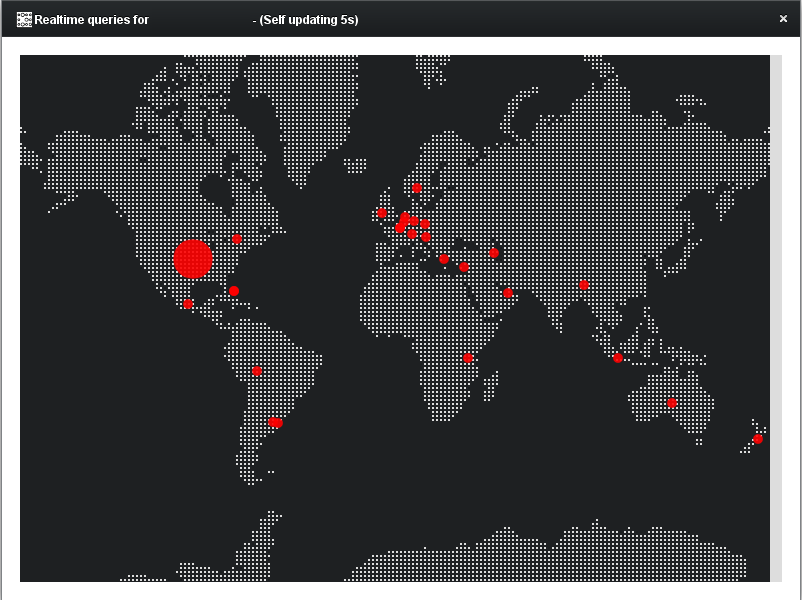
Targets are geographically positioned and their realtime status is shown on the map:
Data intelligence is a free feature. Our technical support team is available to assist you understanding, configuring and getting the most from GSLB.me, for free.
In order to get started with data intelligence and reporting, you can read our howto.