Scenario:
You need to set up your smart DNS configuration so that the DNS resolution algorithm is driven by externally-fed performance/availability indicators, also known as metrics.
In the following configuration example we will assume:
- the FQDN that will be resolved by clients worldwide is mytest.gslb.eu. This is your website/application host name.
- you have two servers (targets) that run contents for mytest.gslb.eu:
- 1 server with IP address 8.8.8.8
- 1 server with IP address 8.8.4.4
- each server is considered available if its CPU load average is < 60% (this is handled by a passive check through metrics pushed to GSLB.me)
How to configure it:
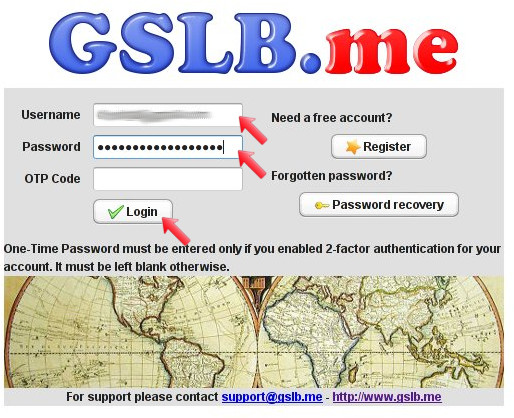
Log on to GSLB.me using your credentials or register if you still don’t have an account
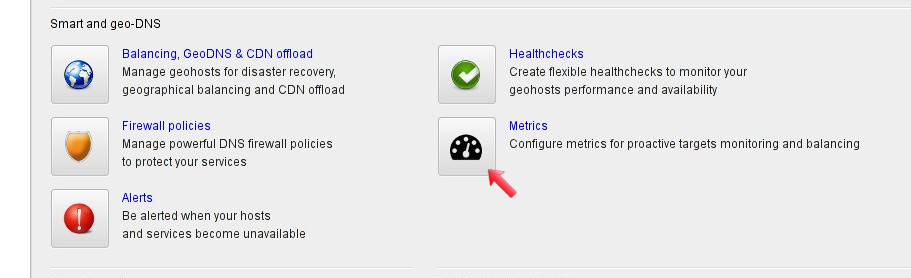
From the main interface dashboard, select the “Metrics” icon to start configuring your custom metrics
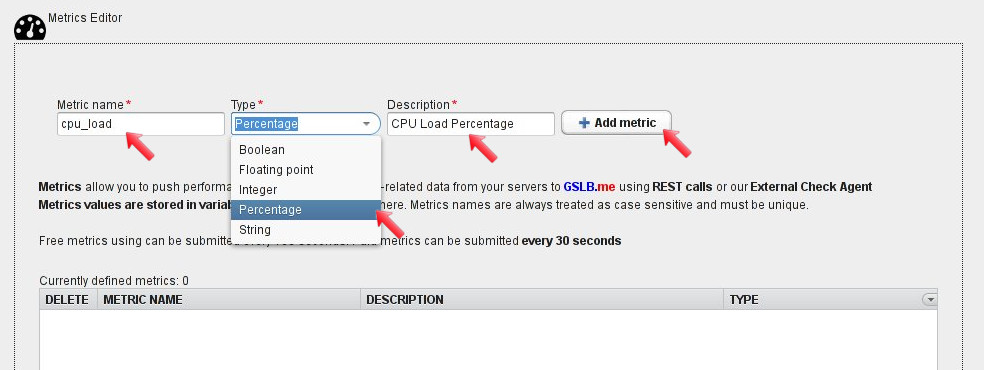
The metrics editor is displayed: here you can set up your metrics names, their type and description. After defining all the metrics you need you will be able to push them to GSLB.me. Free users can define an unlimited number of metrics but can only update one metric at a time per target. Two consecutive updates can be pushed to GSLB.me every 180 seconds. When buying and enabling “advanced metrics collection” for a geohost, an unlimited number of metrics can be pushed per target, with a minimum update interval of 30 seconds.
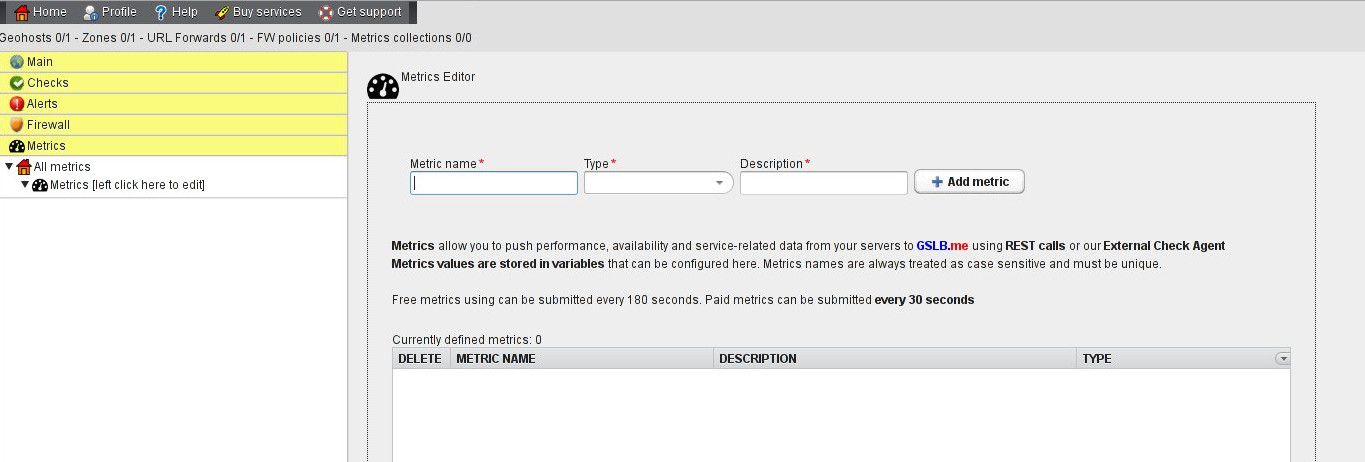
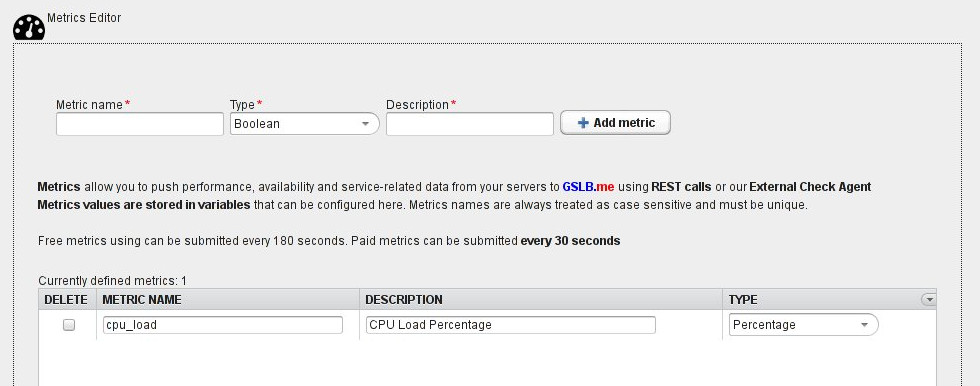
Define the new metrics with the name “cpu_load”, setting type to “percentage” and type its description. When done, click on “Add metric” to create it. Metrics names are case sensitive.
All defined metrics can be edited and deleted by using the table in the lower part of the screen.
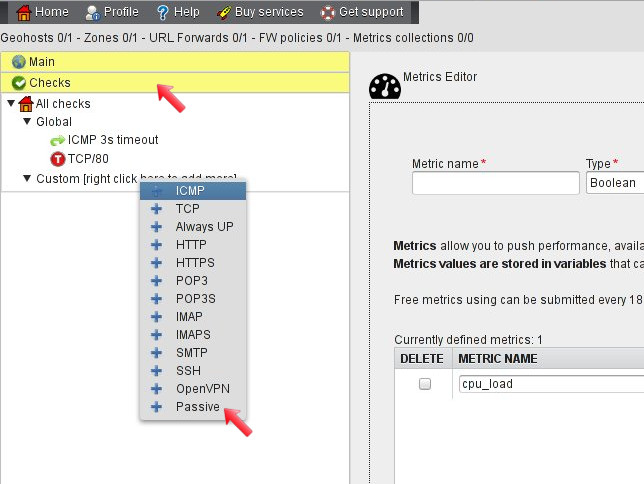
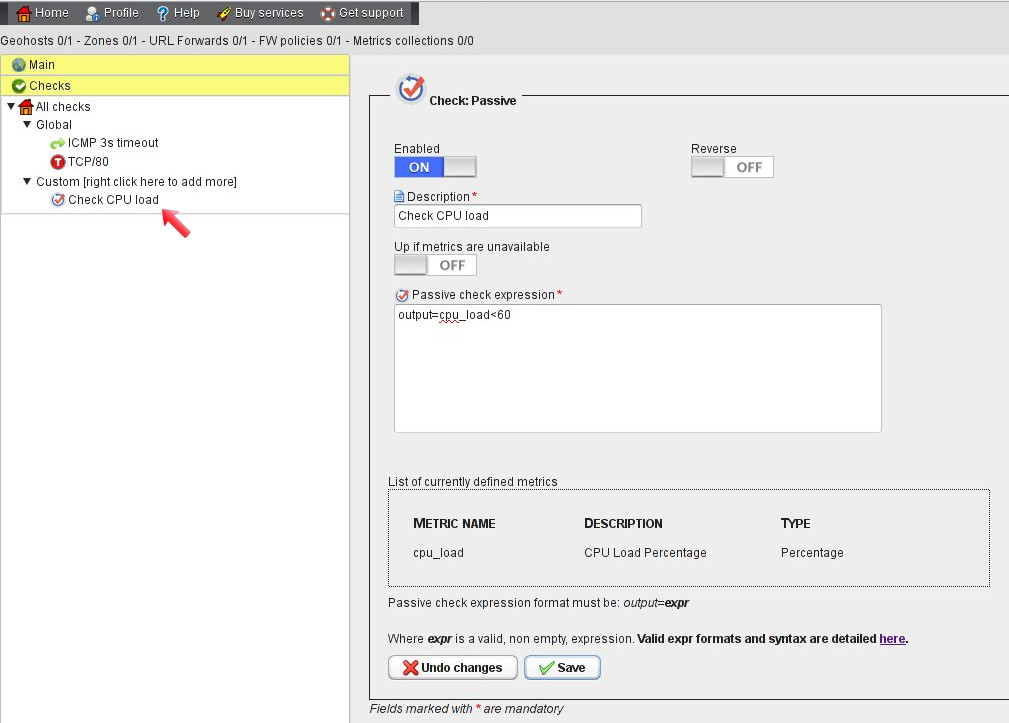
After defining the “cpu_load” metrics, click on the “checks” section in the left section of the screen, then right-click on “Custom [right click here to add more]”. From the menu then select “Passive“.
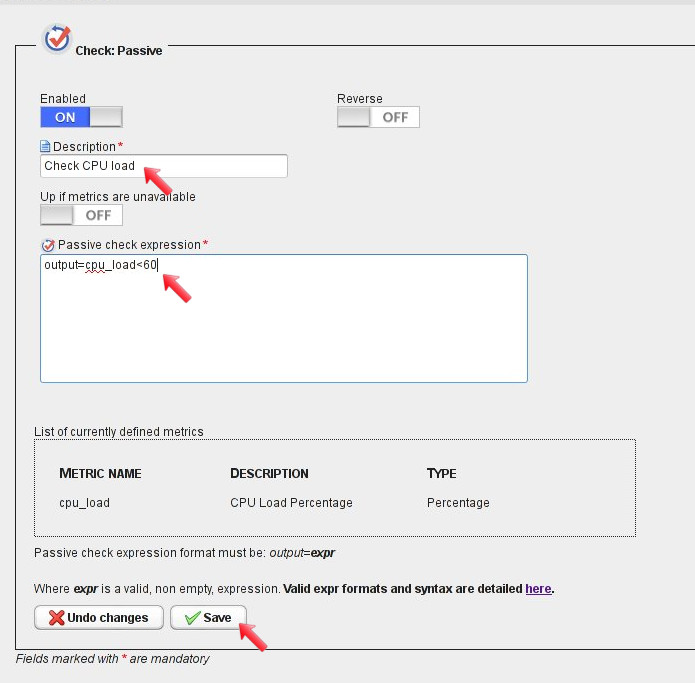
The passive check configuration dashboard is displayed. Here you can type the check description and the expression to evaluate in order to determine the check status. Expressions can be fully customized: full instructions on the syntax to use can be found here
After typing the check description and the expression, click “Save“.
The newly created check is now displayed in the “Checks” section on the left.
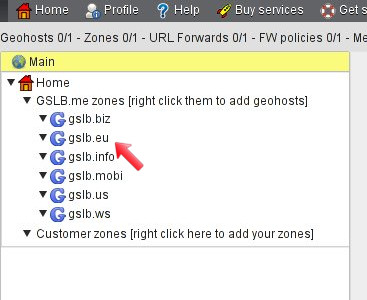
Now click on the “Main” section and right-click the “gslb.eu” zone: from the menu that is displayed select “Add geohost“.
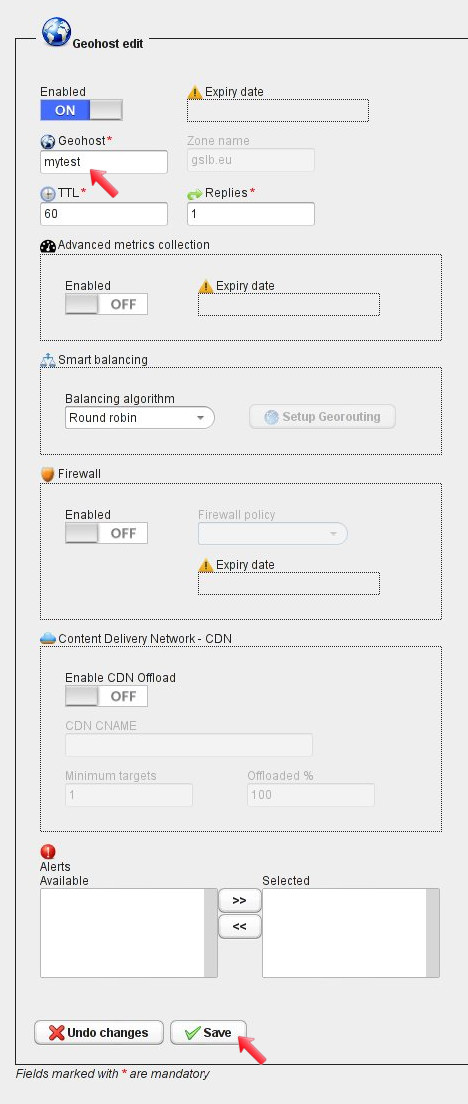
In the geohost configuration panel type the geohost name and save by clicking the “Save” button.
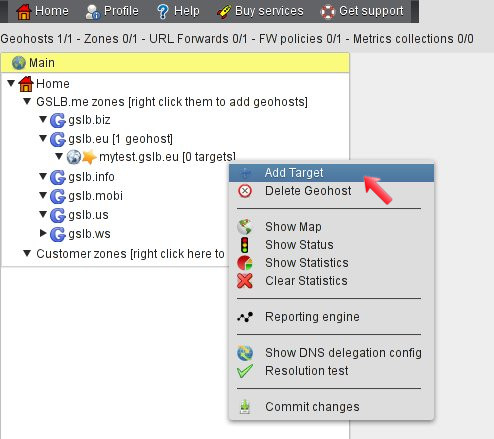
Now add the first target, by right-clicking the geohost name and by selecting “Add Target” from the menu.
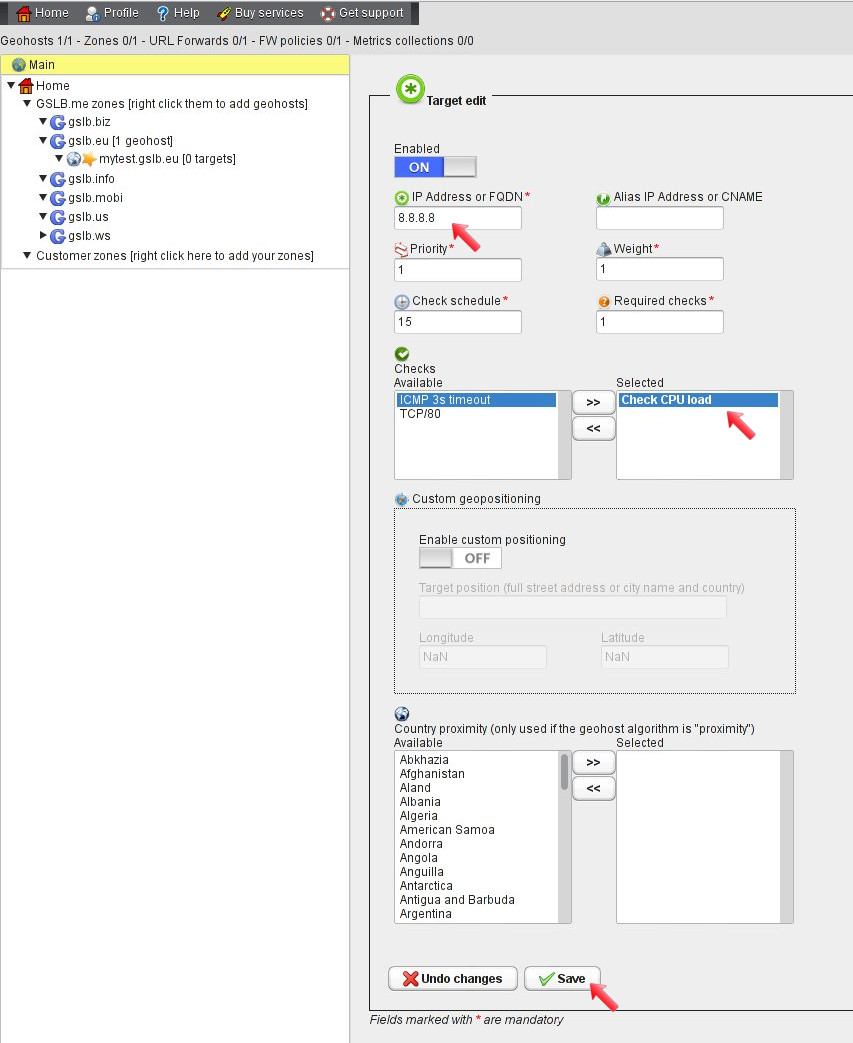
In the target configuration panel type the target IP address and select the “Check CPU load” check you defined previously. This tells GSLB.me to check the target availability using the passive check. Once done, click “Save“.
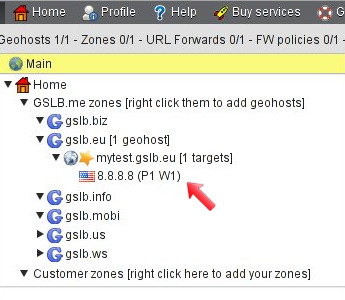
The first target is then displayed in the relevant geohost (mytest.gslb.eu in this example).
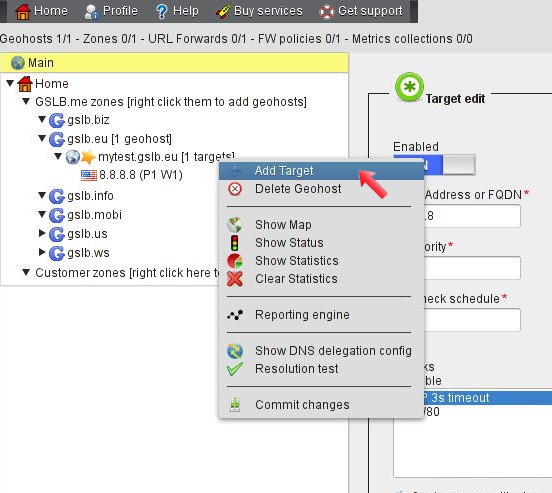
Right-click the geohost name and select “Add Target” again from the menu, to create the second target.
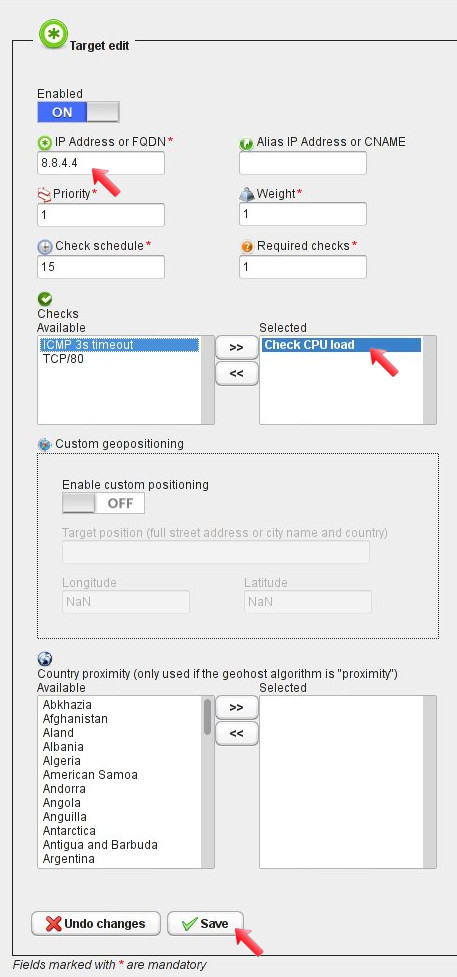
In the target configuration panel type the target IP address and select the “Check CPU load” check you defined previously. This tells GSLB.me to check the target availability using the passive check. Once done, click “Save“.
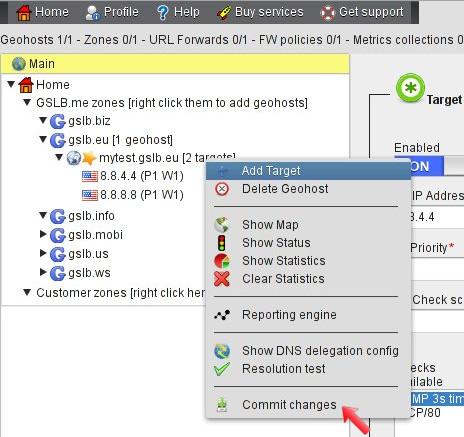
The new geohost now needs to be committed to make it active. You can do this by right-clicking the geohost name and selecting “Commit changes“.
After committing the geohost, the “star” icon beside its name disappears. The geohost is now active.
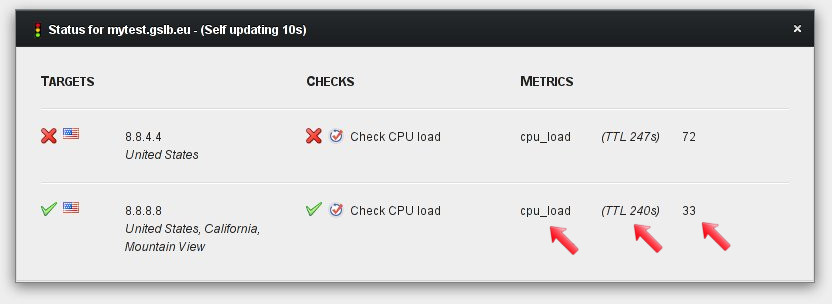
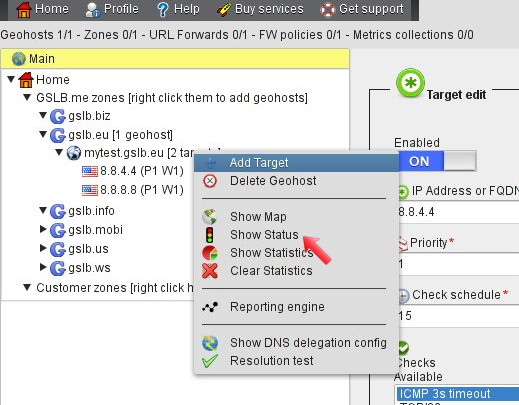
Right-click the geohost name again and select “Show Status” from the menu.
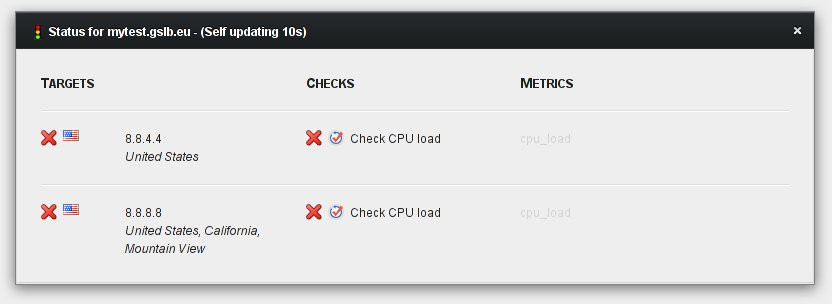
The self-refreshing geohost status window is displayed and both targets are marked “down” since the “Check CPU load” is telling GSLB.me that both targets are not available. When the “Check CPU load” check was defined, its expression was “output=cpu_load<60“, so each target will be marked as “up” only when the “cpu_load” metrics will be less than 60. No “cpu_load” metrics have been pushed to GSLB.me so far, hence the check is returning a “down” response.
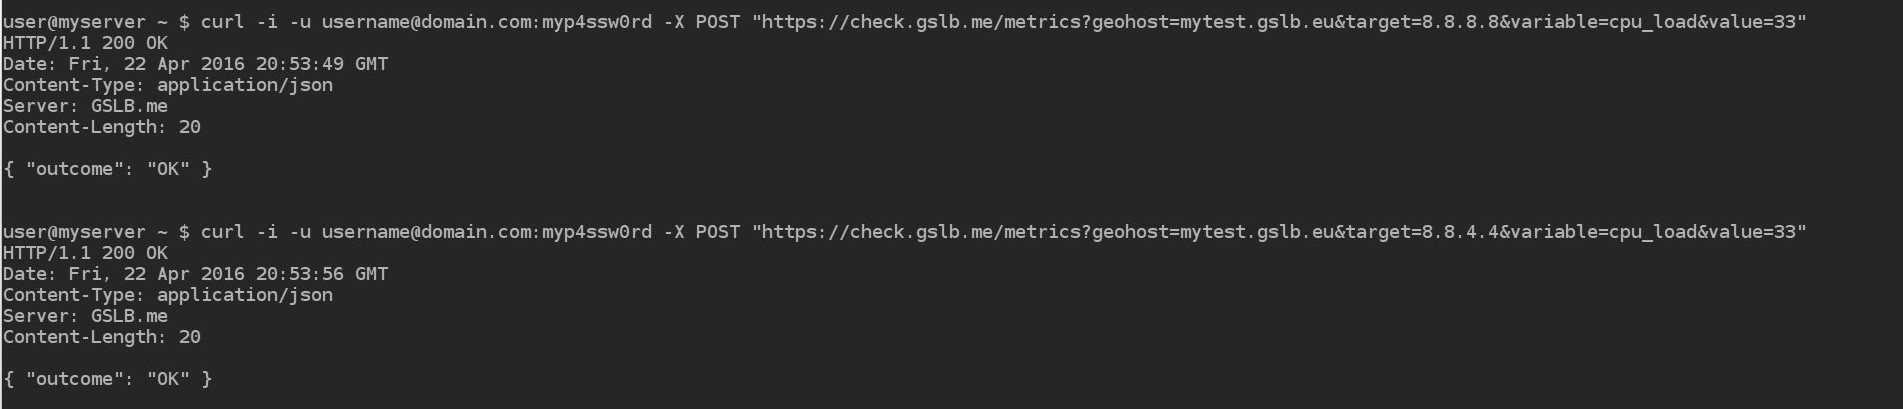
Now it’s time to push to GSLB.me the actual “cpu_load” readings from the two targets: this is accomplished through a simple REST service: “cpu_load” values are computed directly on your infrastructure/servers and can be pushed in a variety of ways, including simple “curl” commands, such as the following. Full instructions on how to use the metrics submission REST service can be found here.
After submitting the “cpu_load” readings and based on the “check schedule” parameter defined for each target, GSLB.me will update targets status and start delivering service based on your metrics, algorithms and business logic.